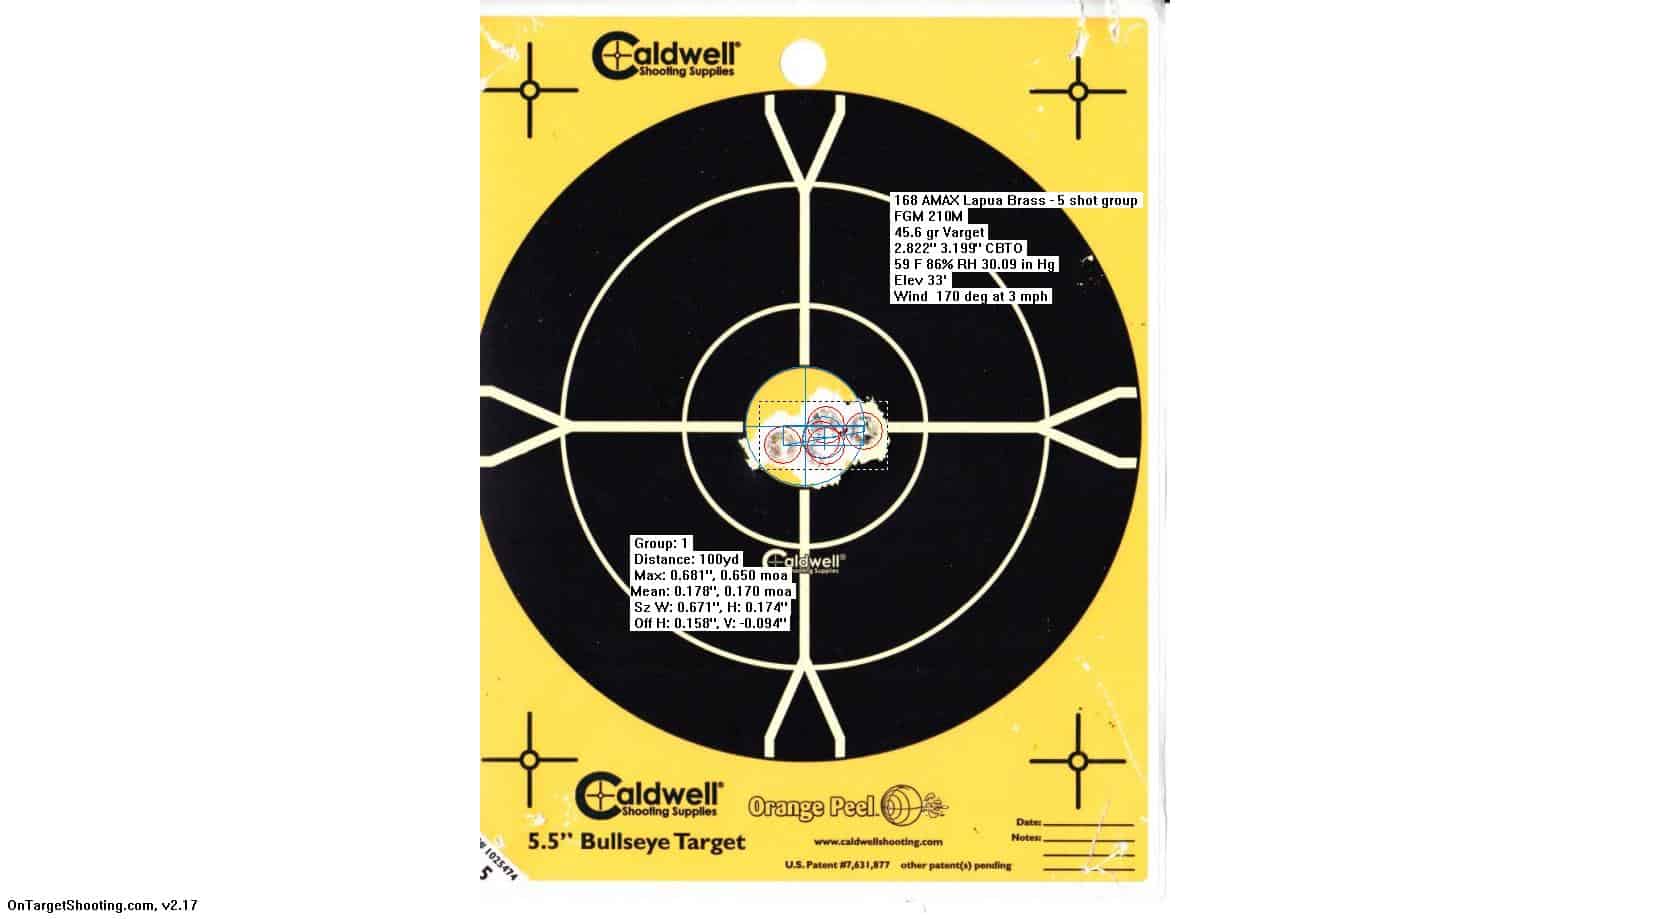
On the quest for accuracy and rifle precision, I have taken an effort to statistically profile one of my firearms. Fully understanding the envelope and limitations of this rifle allows me to have confidence in placing shots on target or game. This analysis uncovers deficiencies in the firearm, ammo and the shooter.
The Rifle
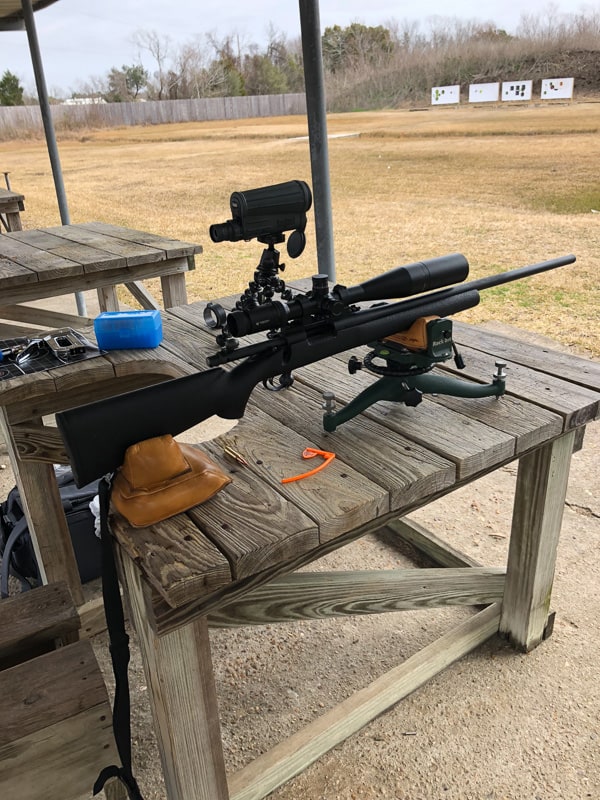
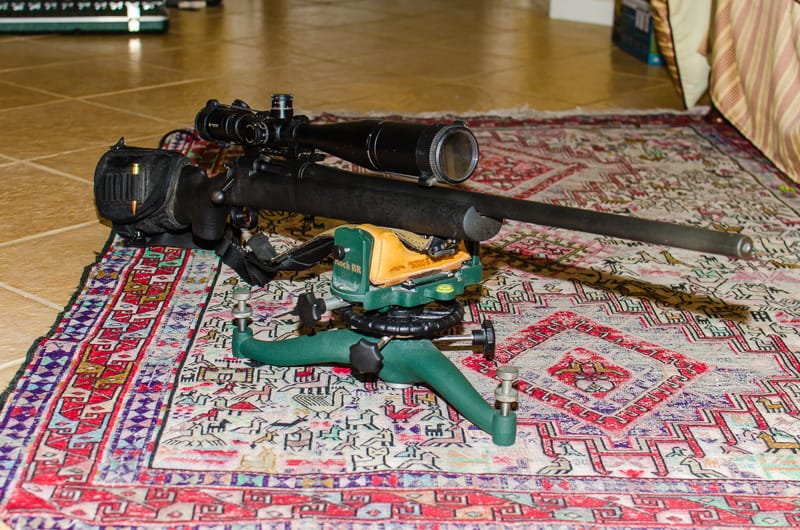
The firearm being evaluated is a factory Remington 700P, chambered in .308 Winchester. The Model 700P is fitted with a 26″ heavy barrel and mounted in an H-S Precision composite stock. The stock is reinforced with fiberglass. In addition the stock features a full length aluminum bedding block. The barrel is a RH twist of 1 in 12. The original trigger on the rifle was not to my liking therefore I have replaced it with a Timney 510 adjusted to a crisp pull weight of 2 ? lbs. An EGW picatinny 0 MOA rail topped with a Vortex Viper PST 6-24 X 50 mounted in Warne 30 mm steel rings completes the package.
Ammo for my Remington 700P rifle precision testing
I am a hand loader and rarely, if ever shoot factory ammo. However there is an expansive selection of bullets for the .308 Winchester. The bullets range from 110 gr Varmint bullets to heavy bullets exceeding 200 gr. My rifle is a 1 in 12 twist, therefore I have limited my maximum bullet weight to 178 gr. Bullets heavier than 180 gr are quite long and can lead to stability problems and a tighter twist rate is preferable. I mainly shoot 150-178 gr projectiles. The testing documented below is specifically for the 168 gr Hornady AMAX. I have found it to be a consistent choice for my Remington 700P. My bread and butter brass for the .308 Winchester is LC, once-fired military brass. Although some believe that the quality and consistency of this brass is not adequate, I have found it to be reliable, accurate, and durable.
Case preparation is important and there are a few steps that are specific to military brass not required of commercial brass. Specifically, military primers are crimped in place and swaging out or cutting out the crimp is necessary to allow seating of fresh primers. My first full case prep consists of full length sizing, swaging out the crimp, uniform the primer pockets, deburr flash holes and trimming all cases to 2.005″. The case necks are deburred and chamfered. On subsequent firings, my steps are – full length sizing with a shoulder bump of .002″ followed by neck sizing again with a collet die. I anneal after each firing cycle to maintain consistent neck tension.
For the data outlined in this article, I tested with Hogdon Varget powder and primed all cases with Federal Gold Medal Large Rifle Match primers.
Testing Overview
Load testing for rifles is a subject that has as many flavors as Baskin Robbins. Debating the best method is beyond the scope of this article. I have chosen what works best for me, under my constraints and with a factory rifle. The approach with a custom firearm with an inherently higher level of accuracy and rifle precision may be completely different.
My approach is fairly simple. Perform Optimal Charge Weight (OCW) testing at 100 yds. to establish charge weights that show potential. Follow this up with tuning sessions at 100 yds. and follow up with testing at 300 yds. I do not have easy access to distances greater than 300 yds. I hope to extend my testing to 500 yds. in the near future. Recording as much data as possible is core to the statistical analysis of a rifle precision test. I shoot all of my testing over a chronograph and save all targets, both good and bad. On my initial OCW tests I usually shoot 3 shot groups and then move to 5 shot groups in the tuning phases.
Which Metric to use?
The Extreme Spread (group size) of a 3 shot group is statistically almost meaningless and I never use it to determine the quality of a load. Instead, I use the Mean Radius and Circular Error Probable as my defining metrics. This will be illustrated below in the testing write up. The result of my testing defines the rifle precision of the Shooting system. The Shooting System in this case consists of the firearm, the ammo, and me the shooter. Hopefully the statistical analysis of the system will help me identify correctable problems within the subsystems.
Testing Details
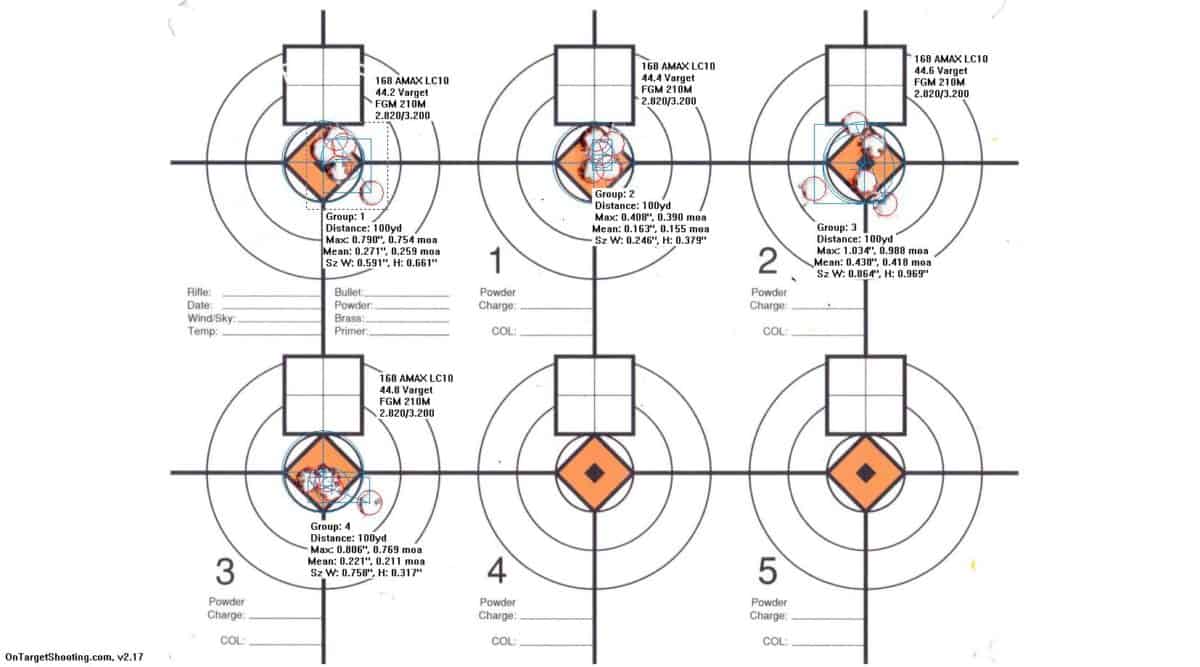
The first OCW was truncated on the high and low charge ends. Due to time constraints it was also performed over two shooting sessions. This was done because I had previous experience with Varget and the 168 AMAX bullets. I started the OCW at 43.0 gr and topped out at 44.8 gr. Overall cartridge length was 2.825″, with a cartridge base to ogive length of 3.200″ (with my comparator). Cases were primed with Federal Gold Medal Match Large Rifle primers. This was a coarse test to confirm a well-known load of 44.0 gr.
Session 1
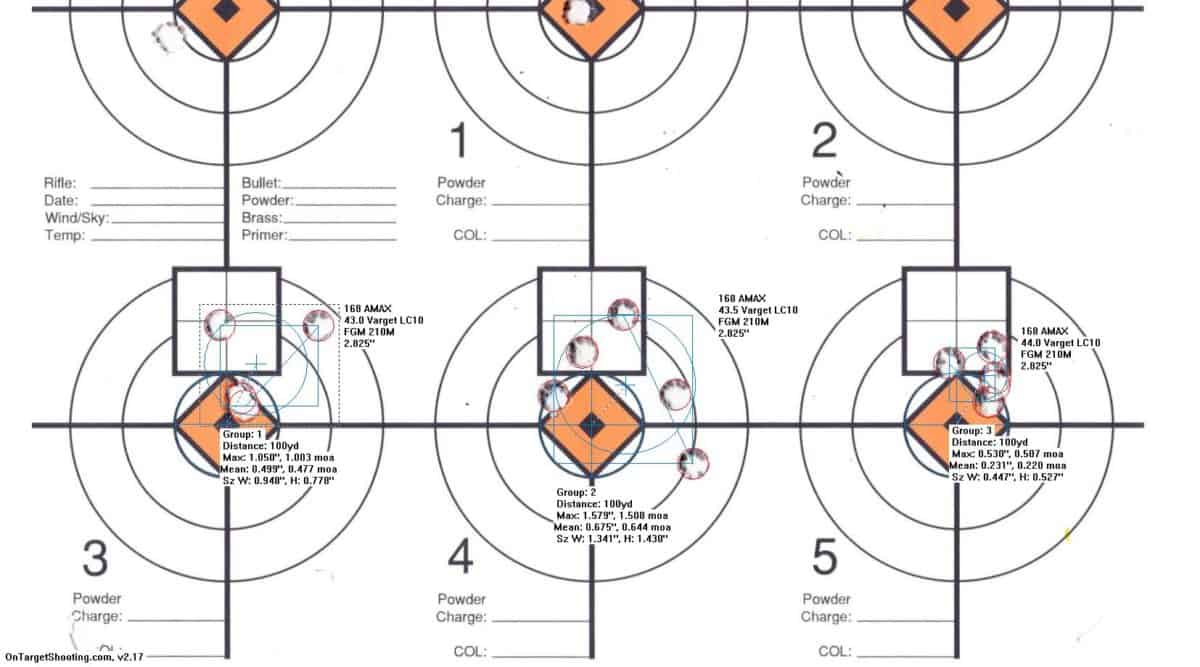
Session 2
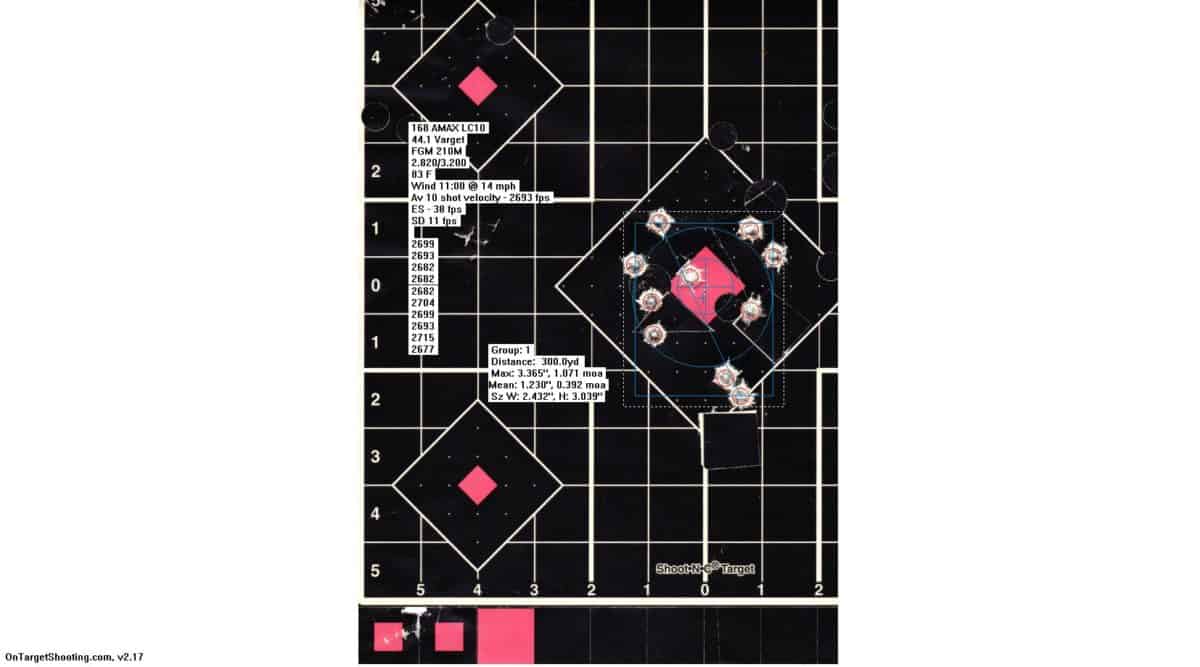
After review of the targets I choose to further test with 44.1 gr of Varget loaded to a maximum magazine length. Although the wind conditions were not ideal, I shot a 10 round group over chronograph at 300 yds. The load printed @ 1.071 moa extreme spread and a Mean distance from center of 0.392 moa. The ammo produced an Average MV of 2693 fps with a Muzzle Velocity Extreme Spread of 38 fps and a Standard Deviation of 11 fps.
While an acceptable result, I needed further evaluation and development. The 168 gr AMAX seems to be an accurate bullet from my rifle and showed possibility of better performance.
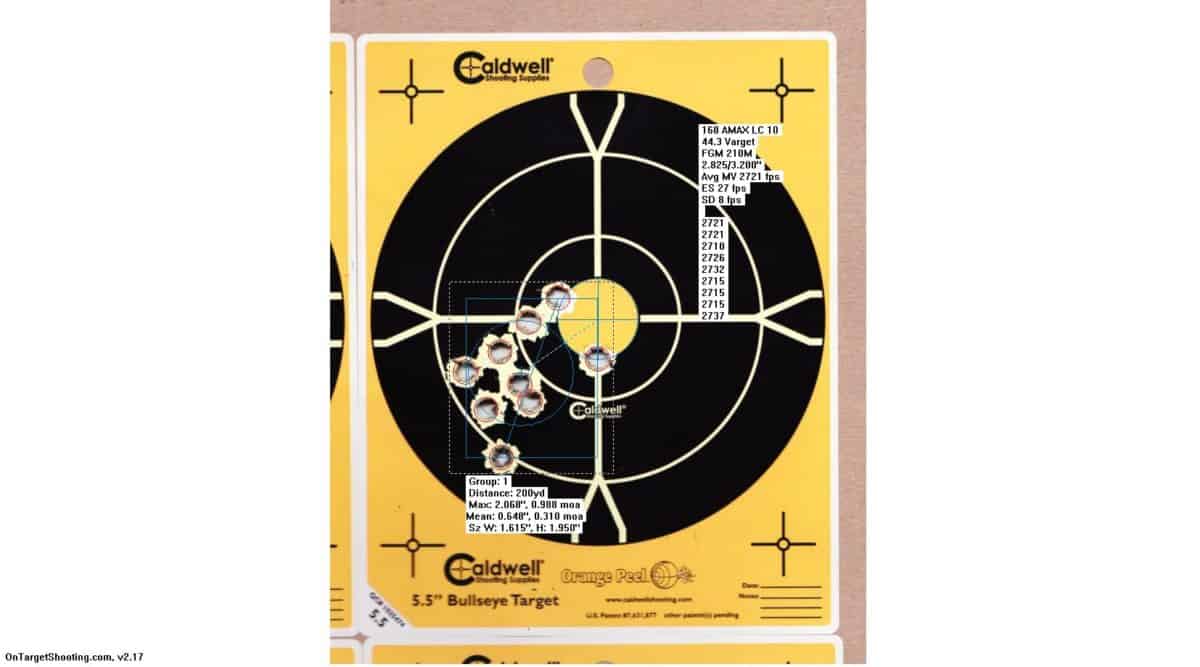
My plan was to shoot an additional 10 shot group at 300 yds, but I was limited to the 200 yd distance that day. In addition, I tweaked the powder up by 0.2 gr and shot a 10 shot group over a chronograph. The average MV was 2721 fps with and ES of 27 fps and an SD of 8 fps. A slight improvement in ES and SD from the 44.1 gr load was observed. While the group printed under 1 moa (0.988), vertical stringing was more than just shooter induced. I believed further improvements were possible.
As a result of the last test, I decided to adjust the seating depths and test at 44.3 gr and at 100 yds
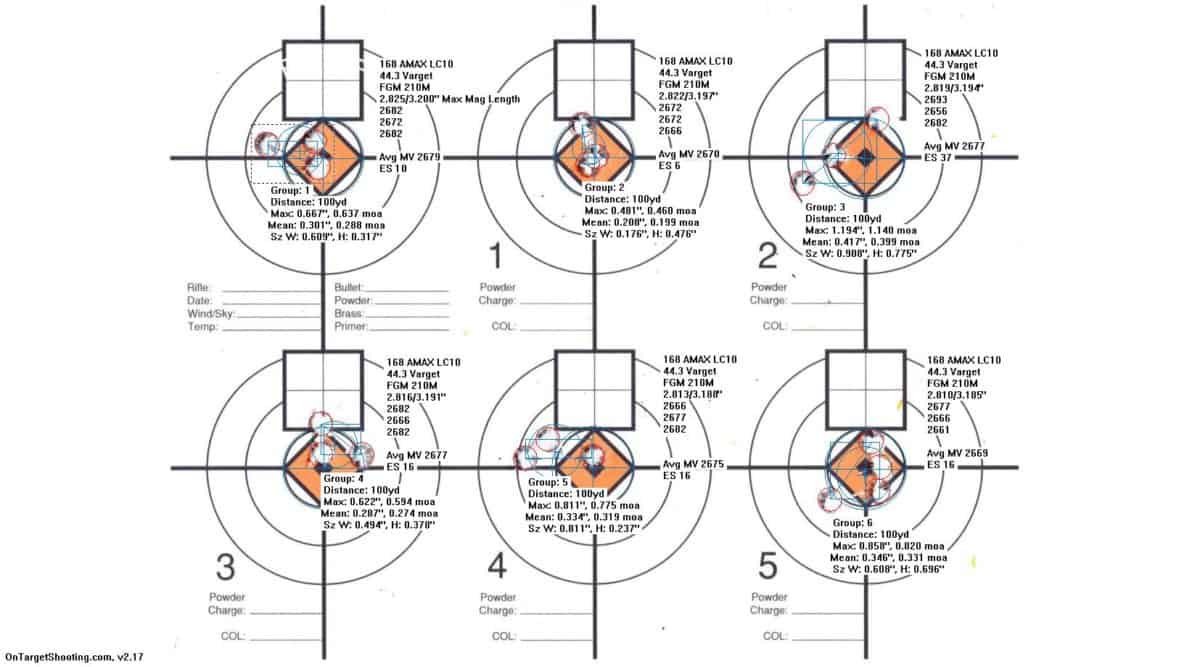
I shot 6 groups with and seating depth increment of .003″ from my original loads tested. After reviewing this test, I decided to reduce my CBTO length by .003″ in future development testing. This seemed to be the best compromise between ES and vertical dispersion. An additional 0.1 gr powder charge was loaded for another 300 yd test.
The following 5 shot groups were used as the basis for statistical analysis.
Group 1
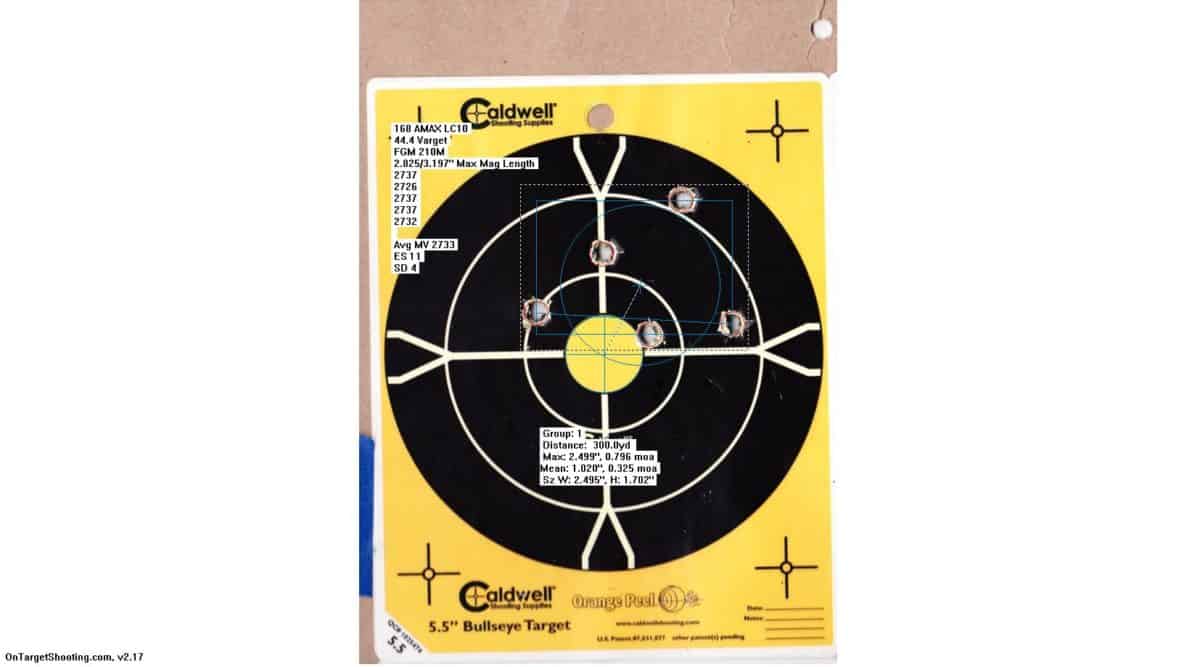
This group printed a spread of 0.796 moa with an average to center of 0.325 moa. The average MV was 2733 fps with an ES of 11 fps and an SD of 4 fps.
Group 2
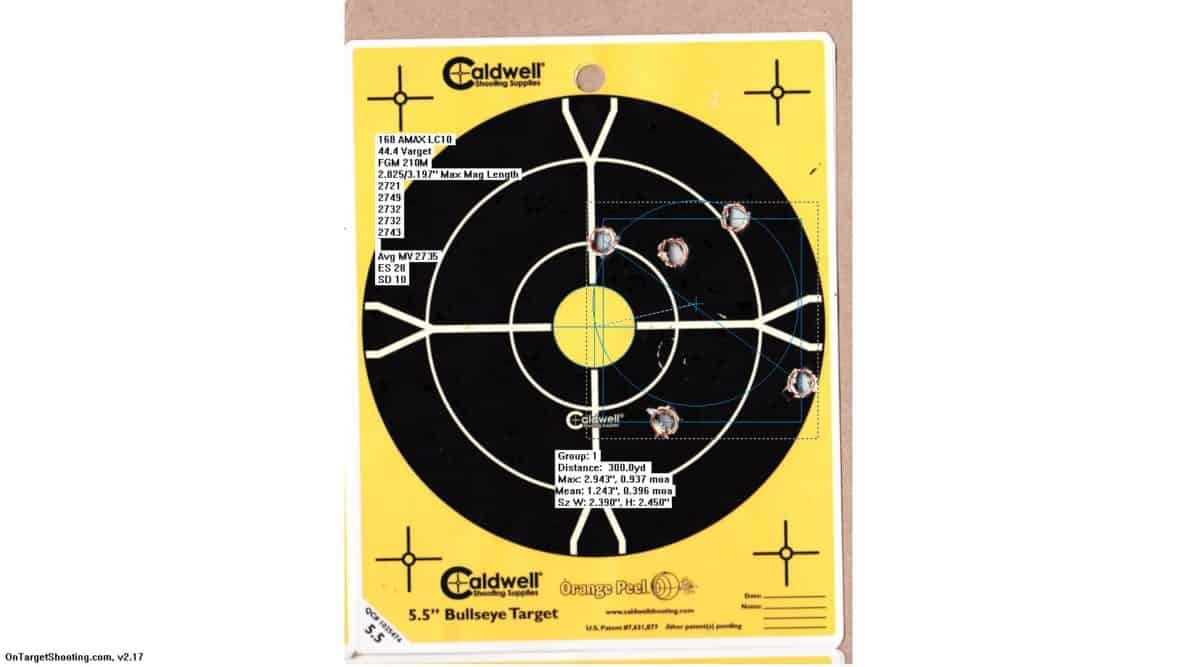
This group printed a spread of 0.937 moa with an average to center of 0.396 moa. The average MV was 2735 fps with an ES of 28 fps and an SD of 10 fps.
Group 3
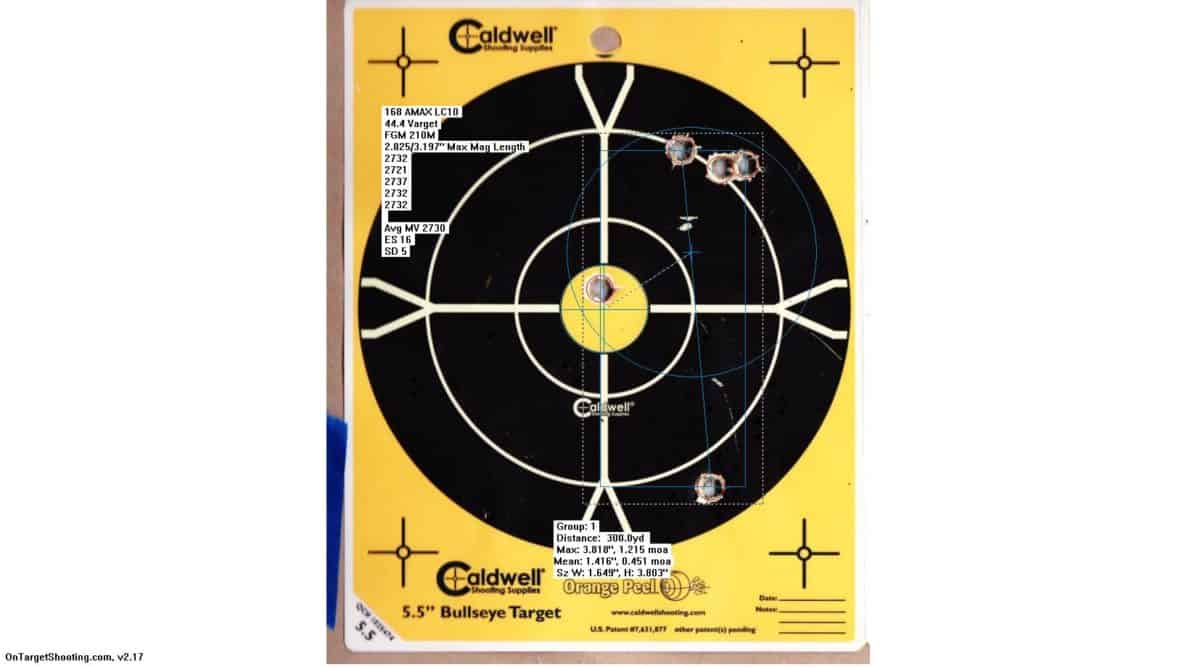
This group printed a spread of 1.215 moa with an average to center of 0.451 moa. The average MV was 2730 fps with an ES of 16 fps and an SD of 5 fps. Although this group was seems different than the rest of the groups shot this day, the group center is clearly very similar. The ES and SD of the loads were quite good and I can only postulate the dispersion in this group is a result of normal distribution
Group 4
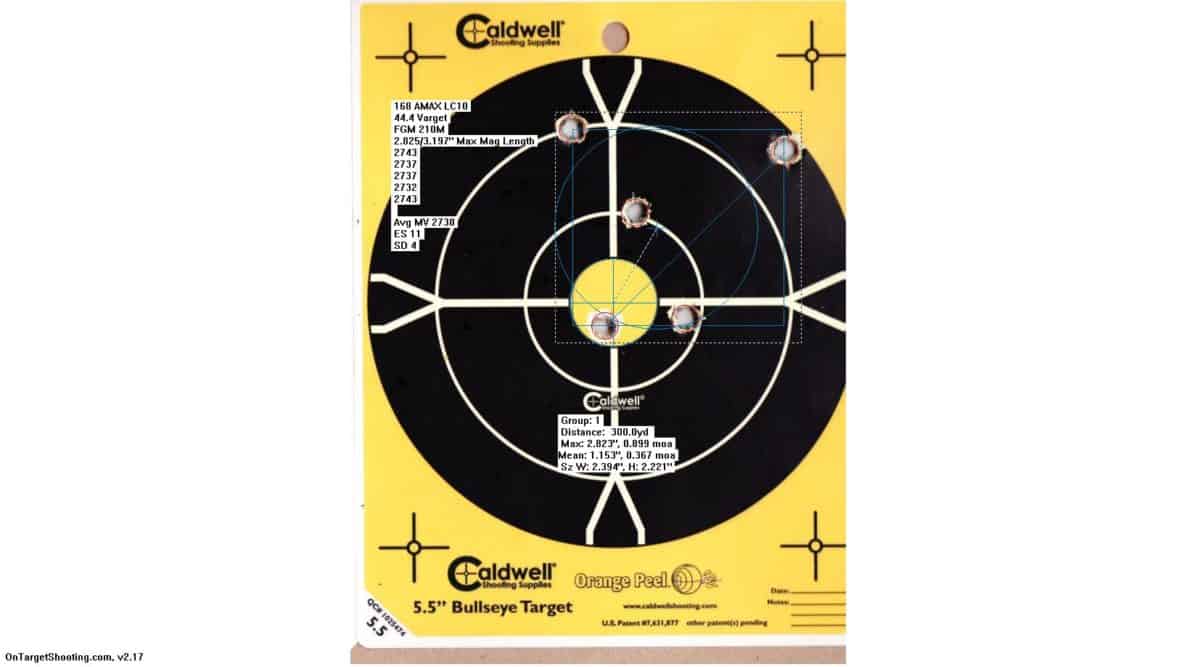
This group printed a spread of 0.899 moa with an average to center of 0.367 moa. The average MV was 2738 fps with an ES of 11 fps and an SD of 4 fps.
Statistical Analysis
In this analysis I used the shotGroups package for the open-source statistical environment R. This package allow for a comprehensive shot group analysis. Using point data exported from OnTarget Precision Calculator allows for convenience in entering data to the statistical analysis package. The package provides insight and helps in the following areas:
-Determining the likelihood of a hit
-Comparing the inherent rifle precision of different shooting systems.
-Determining which ammunition shoots better in a particular gun.
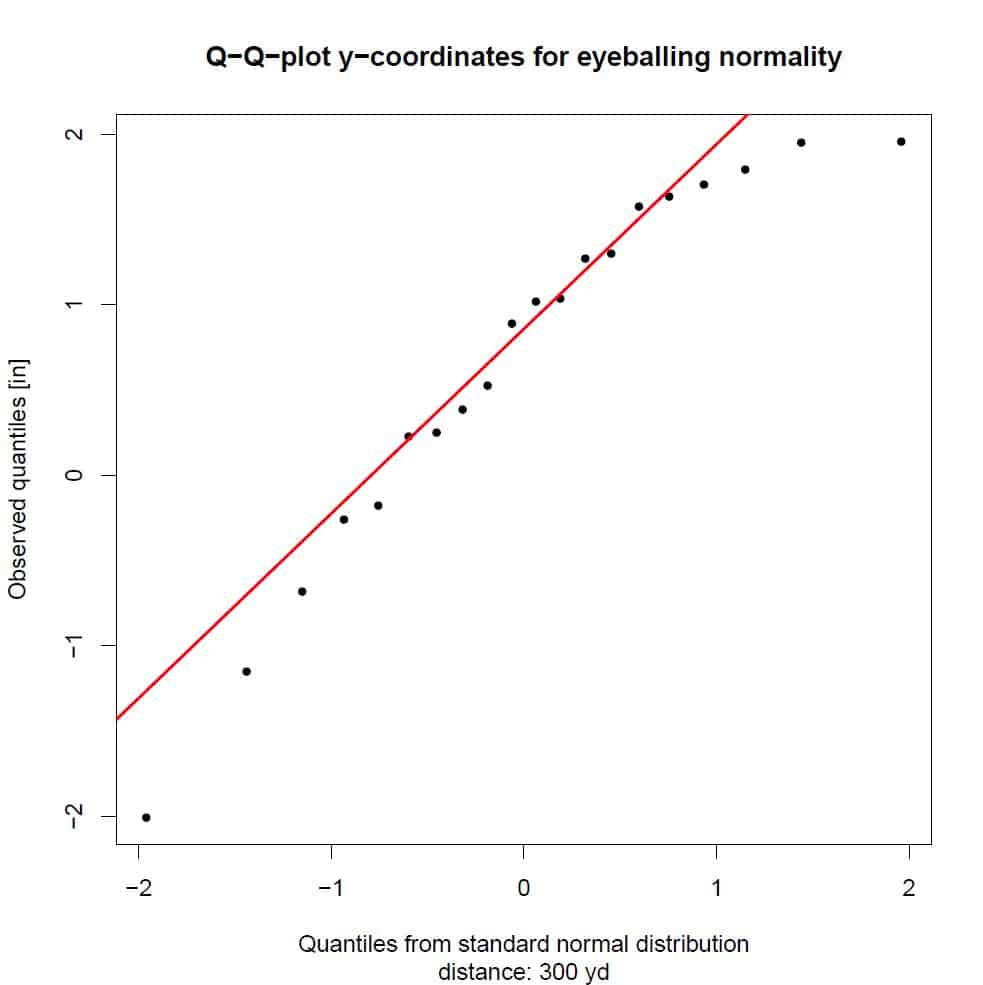
Although the majority of the y distribution appears normally distributed, there is some tailing on the extreme ends.
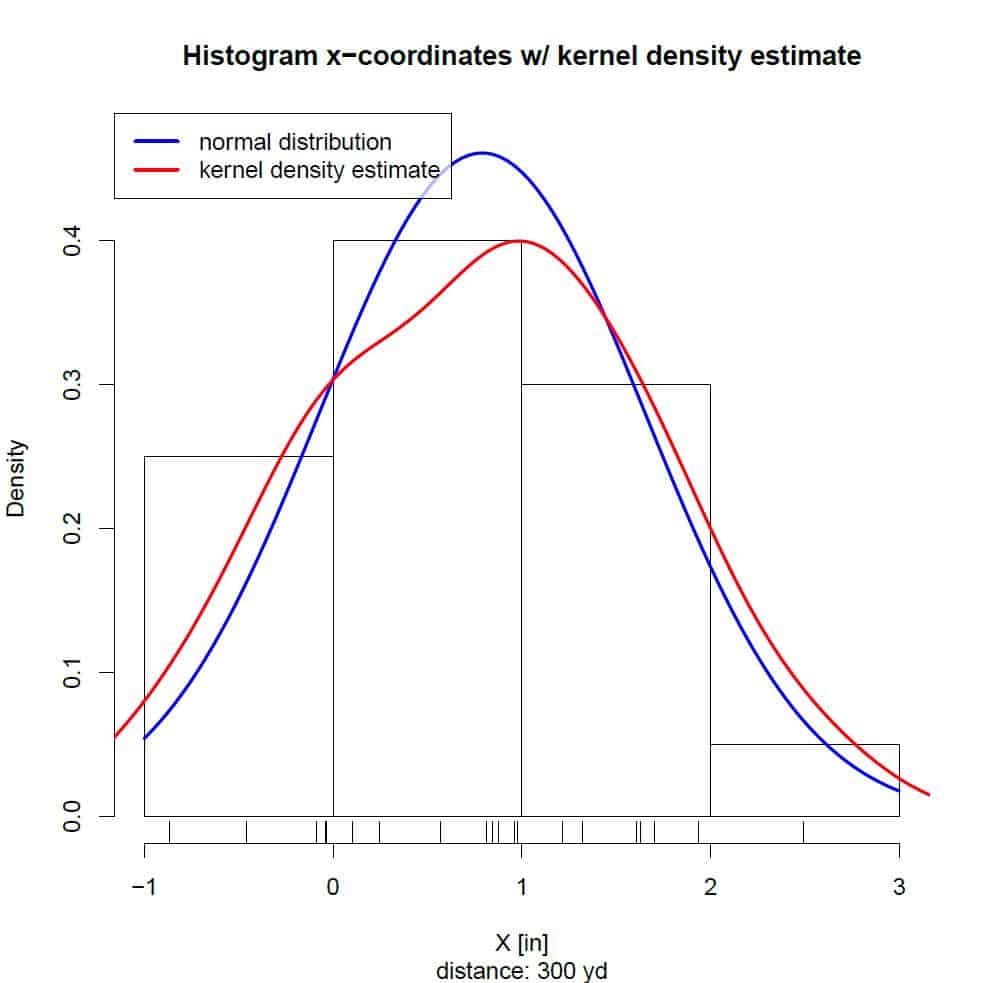
Histogram indicates good adherence to a normally distributed data set for horizontal distribution.
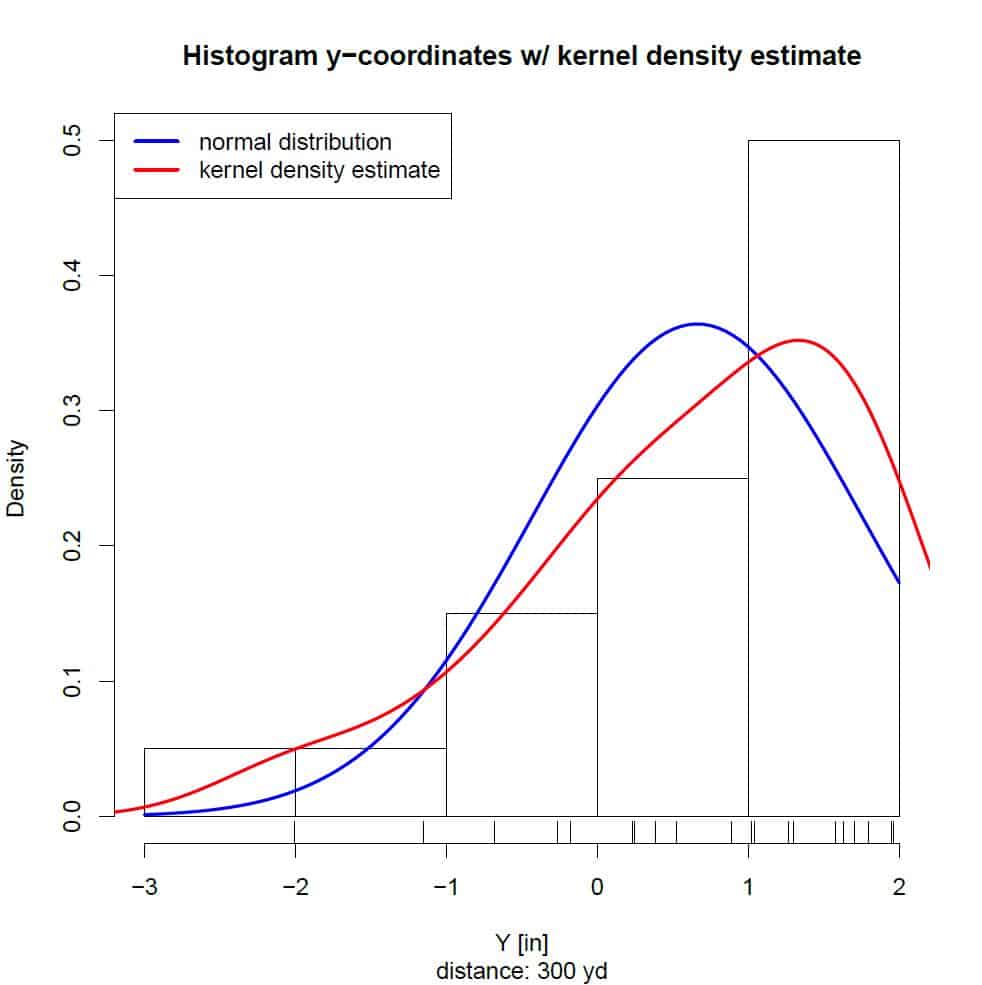
The vertical (y) histogram confirms the tailing and indicates some deviation from normal distribution
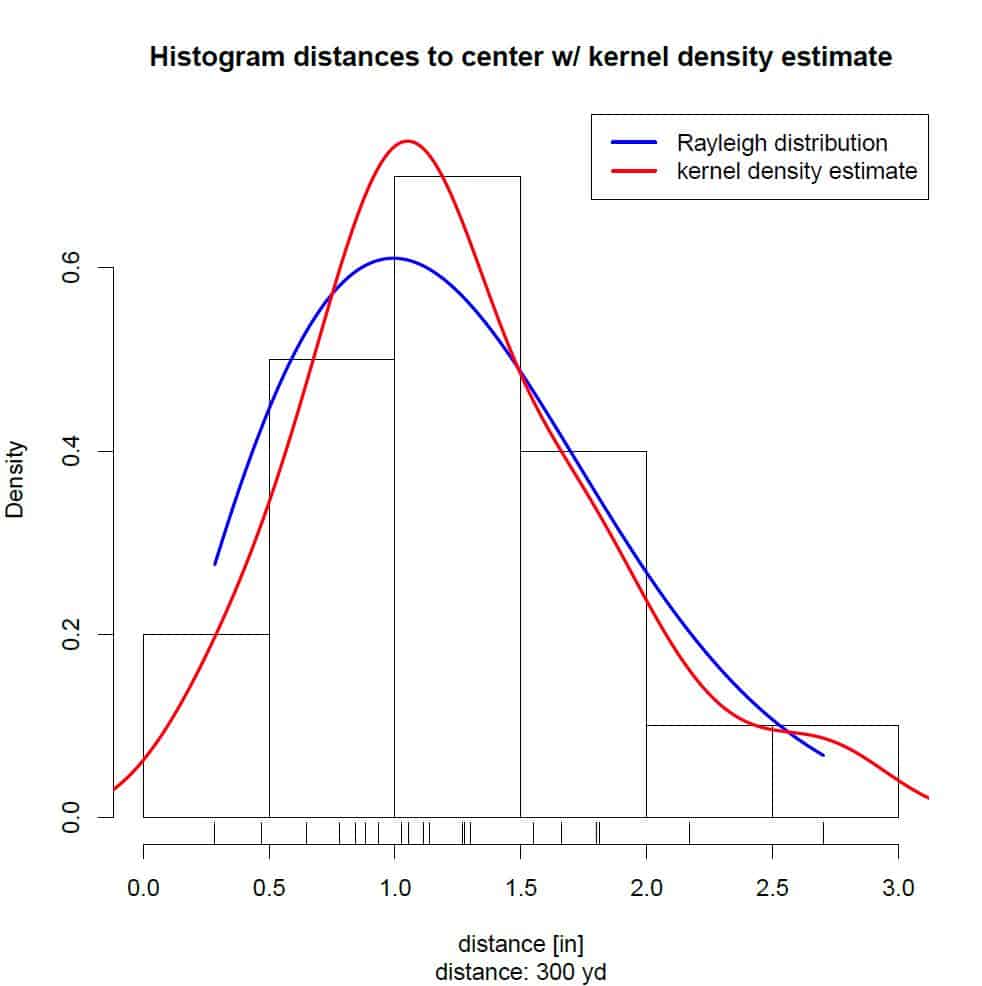
Reasonably good distribution of distance to center
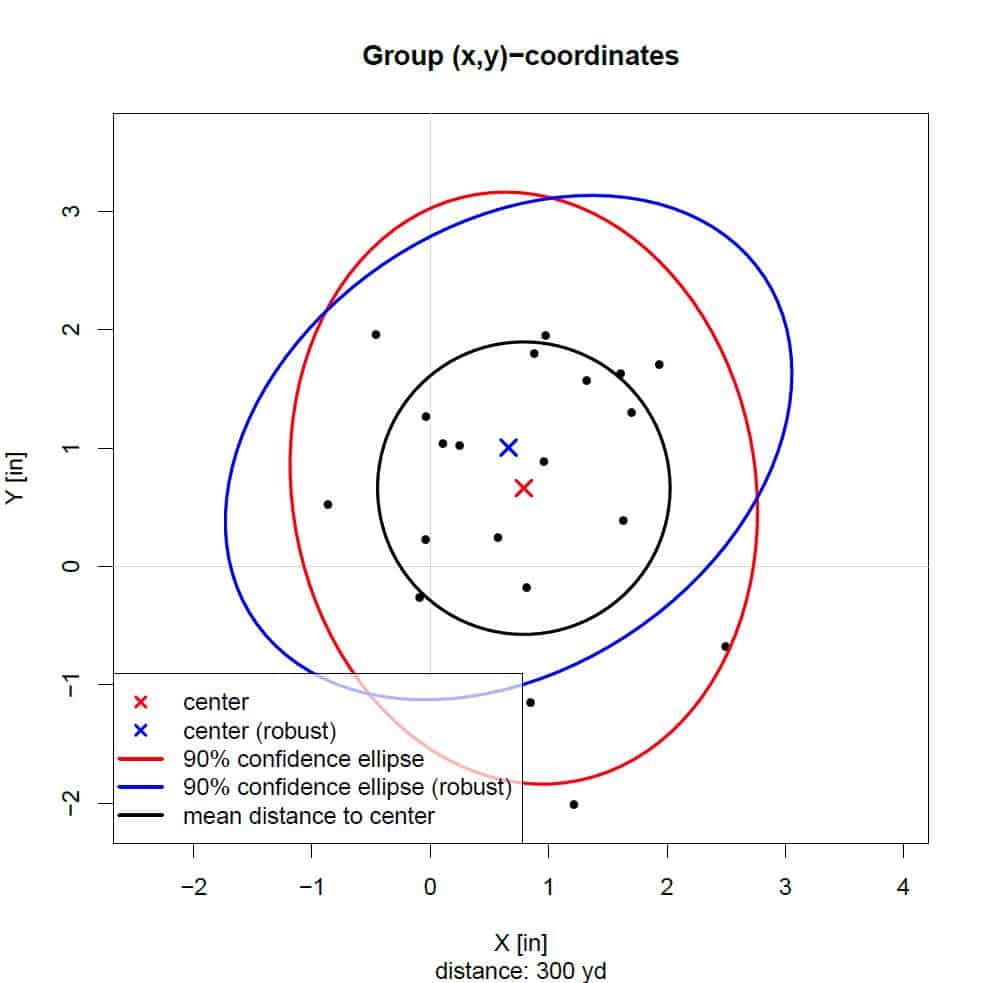
A graphical illustration of a 90% probability the mean falling within the ellipses. Precision can be improved by adjusting POI approximately 1 MOA down and 1 MOA left.
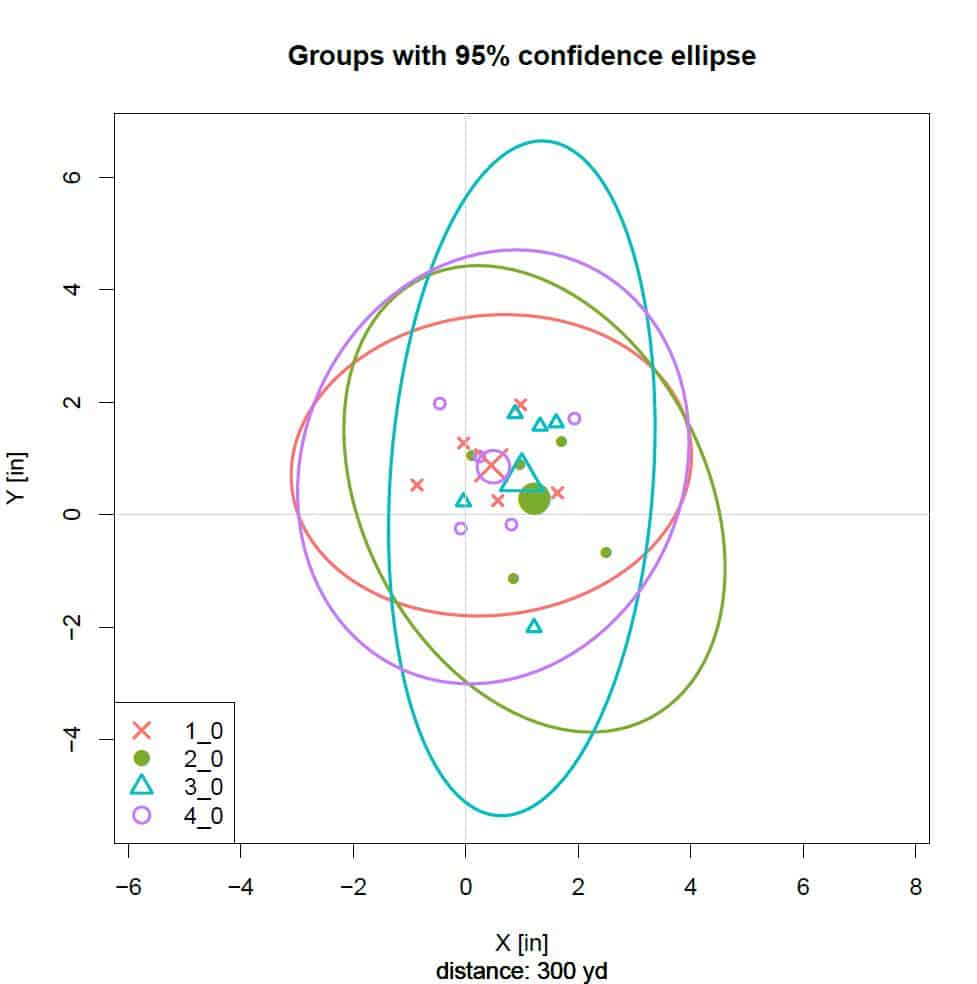
This is a graphical illustration of a 95% confidence of mean falling within the ellipses for individual groups. Note the tall vertical probability for group 3. This is the group that showed the flier. However, the muzzle velocity of this group was very consistent and I am leaning towards eliminating that as a cause. This dispersion may have been caused by bullet runout or a unbalanced projectile. Or maybe the shooter? The most likely answer though is that these “fliers” are just parts of the normal distribution of the shooting system
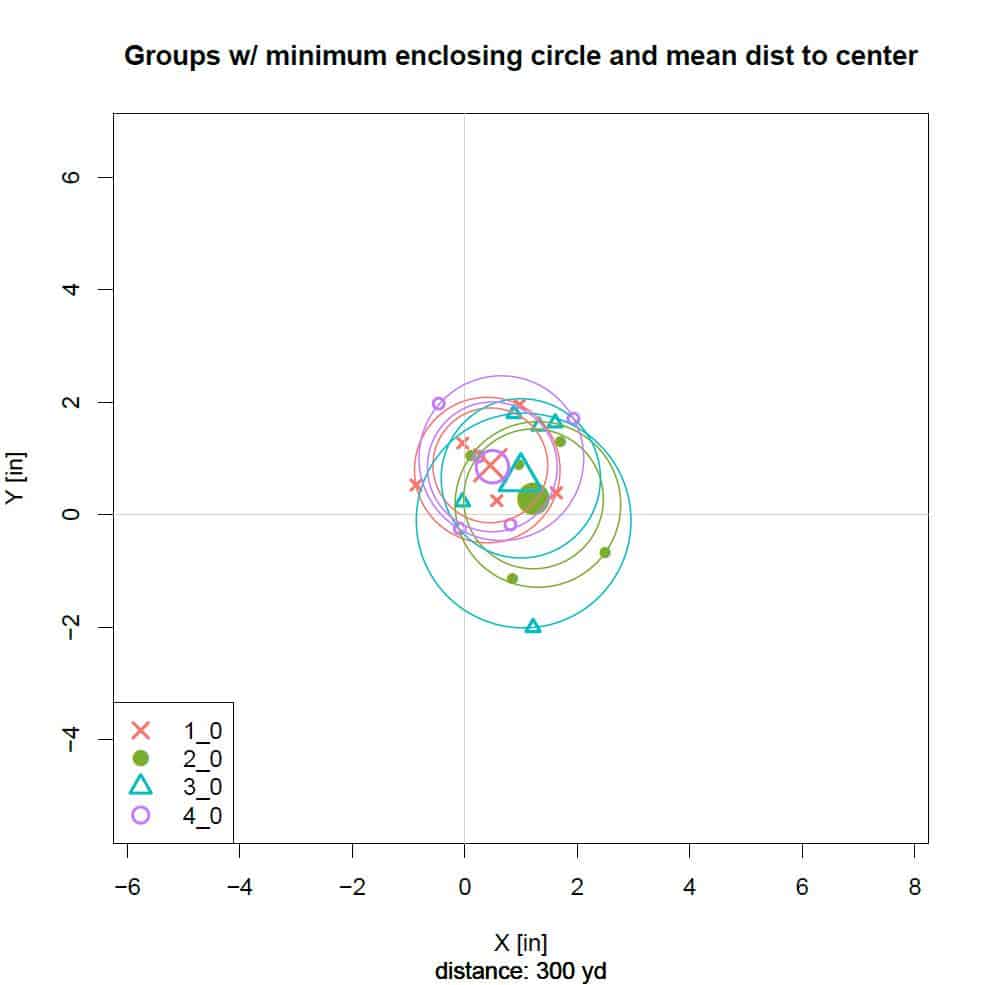
Although the previous plot shows a large elliptical probability for group 3, the mean distance to center for that group was mitigated by the tight grouping of the rest of the shots.
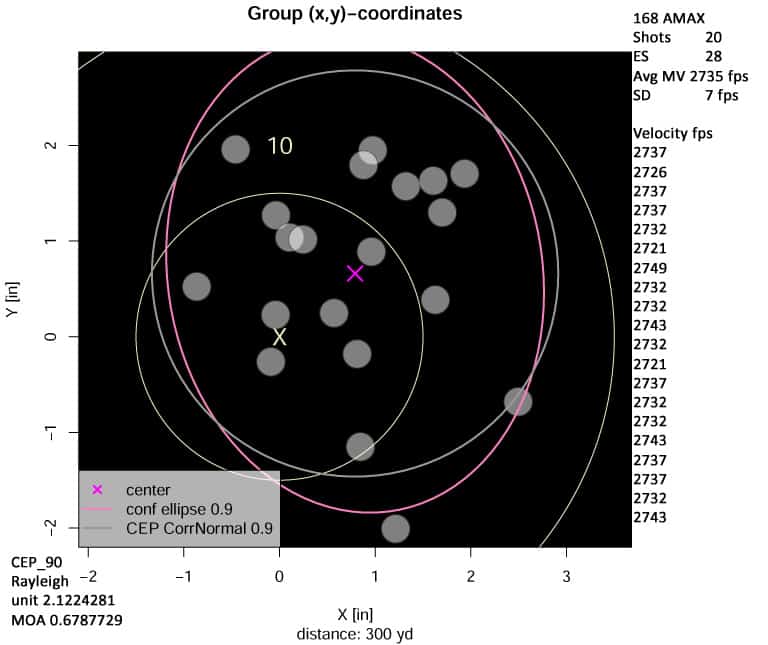
Circular Error Probable
This group shows a Circular Error Probable of 90%. Circular Error Probable 90% is defined as the radius of a circle, centered on the mean. The extent is expected to include the impact points of 90% of the rounds fired. This can be used to evaluate the probability of a hit. In this case the expected radius is 2.1224281″ or 0.6787729 MOA. It can be inferred that there is a 90% probability of a hit within 2.1224281″ of the mean center of the group. One would expect the CEP to be 2.0292865″ or 0.6459419 MOA, if the scope is adjusted to better center the POI at the POA. As you can see, 18 of the 20 shots fall within the CEP. Be aware that CEP does not vary with group size. Taking more shots tightens the confidence interval but doesn’t change the expected value. In contrast, Extreme Spread increases with group size.
So, what does this mean and how is it useful?
When evaluating the rifle precision of shooting systems it is important to consider the major sub systems. The firearm, the ammo, and the shooter make up the majority of the evaluation of rifle precision. When analyzing a target, the only thing available for evaluation is the rifle precision of the system as a package.
As a hunter and casual target shooter, the most important thing to me is rifle precision. The knowledge of hit probability is especially important when sending projectiles at game at distance. It is an ethical responsibility of any hunter to strive for precisely placed shots resulting in quick and clean kills. The most important takeaway from this analysis for me is the Circular Error Probable of 90%. This gives me a level of confidence in the capability of my shooting system. It provides me with a realistic expectation of the system capability and allows me to make intelligent decisions before I pull the target.
Focus on Technique
After considering the horizontal distribution of some of the group statistics, I have concluded that the shooter (me) is responsible for some of the dispersion. This caused me to focus on the fundamentals and consistency in my technique. Going back to the range, I shot an additional 5 shot group at 300 yards. My key objective was to focus on technique and repeatability. The result speaks for itself. Under less than ideal conditions, I was able to print a 300 yard group at 1/2 moa. I attest this significant improvement to concentration and attention to technique, more than anything else.

In future I intended to increase the range of this system combination to evaluate the changes in rifle precision. If I can maintain a CEP 90% that is appropriate for hunting, it will provide me with the level of confidence to take shots at game at that distance.
UPDATE – Stretching out – 500 yards
Recently I was in the position to set up a 500 yd shot. (actually lasered out at 498 yds). I’m more than pleased with the outcome, despite a gusty wind and quite a bit of mirage. Shot my first shot from the back of an ATV off of 2 bags of deer corn. From my 100 yd sight in, I dialed in 3.1 Mils, elevation and 0.1 mil windage. I drove down to the target at 498 yards and found my shot 9.5 inches high (~0.5 mils) and 5 inches right. (~0.27 mils) The vertical dispersion didn’t match with all my previous testing at 300 yds. Shooter induced error on that first shot may be an explanation. The windage seemed to be in line with the gusty southeast wind. I was pretty sure the high first shot was a result of my position off the deer corn bags.
My ballistic app actually called for 3.0 Mils up and 0.3 mils L. I chose to trust my app for the correct firing solution and I went back to the 498 yard mark and dialed in 0.2 mils additional L windage, and dropped my elevation to the calculated 3.0 Mils. I took 3 additional carefully placed shots and was excited to see the result! The 3 shot group printed a maximum spread of 2.395″ – 0.459 MOA. Dispersion observed on the single initial shot was a shooter induced pull.


Dispersion Question
Although I only had time able to make limited shots at 500 and a single group is statistically insignificant, the result is perplexing. The dispersion at 498 yards was significantly less than the groups I posted at 300 yards. Based on the opinions I gathered, it doesn’t seem possible that a rifle can be consistently more accurate at long range that at a shorter range. In order to put this notion to rest I’ll have to stretch out this load and system to 500 yards and beyond for much more than 3 shots. Stay tuned and I’ll come back with a larger sample size of long distance shots.
Update:
Below is a combined target with 86 total shots over multiple range sessions at 300 yards. I shot a load consisting of the following under variable environmental conditions and over a period of several weeks:
Brass – LC 10
Projectile – 168 gr Hornady AMAX
Powder – 44.4 gr of Varget
Primer – CCI 200
Loaded to a maximum magazine length.
Environmental – Variable
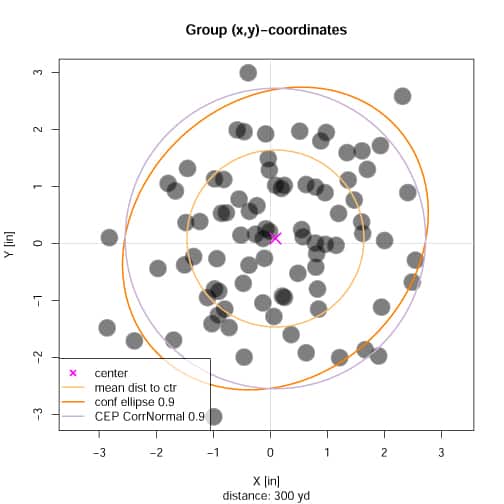
CEP_90% CorrNormal
unit 2.6349887
MOA 0.8387429
SMOA 0.8783296
mrad 0.2439804
DistToCtr (CTC Mean)
unit 1.5520419
MOA 0.4940303
SMOA 0.5173473
mrad 0.1437076
The quest continues!
The latest practice shows improved shooter skills. I continue to improve the outcome with additional trigger time. A change in brass and primer may have contributed.
Brass – Lapua
Projectile – 168 gr Hornady AMAX
Powder – 44.4 gr of Varget
Primer – FGM 210M
Loaded to a maximum magazine length.

Update – 600 yard 3 shot group
I had a chance to shoot a four round group at 600 yards. Not great. At least i was on the paper. I need more practice and am testing a higher node at 45.6 grains
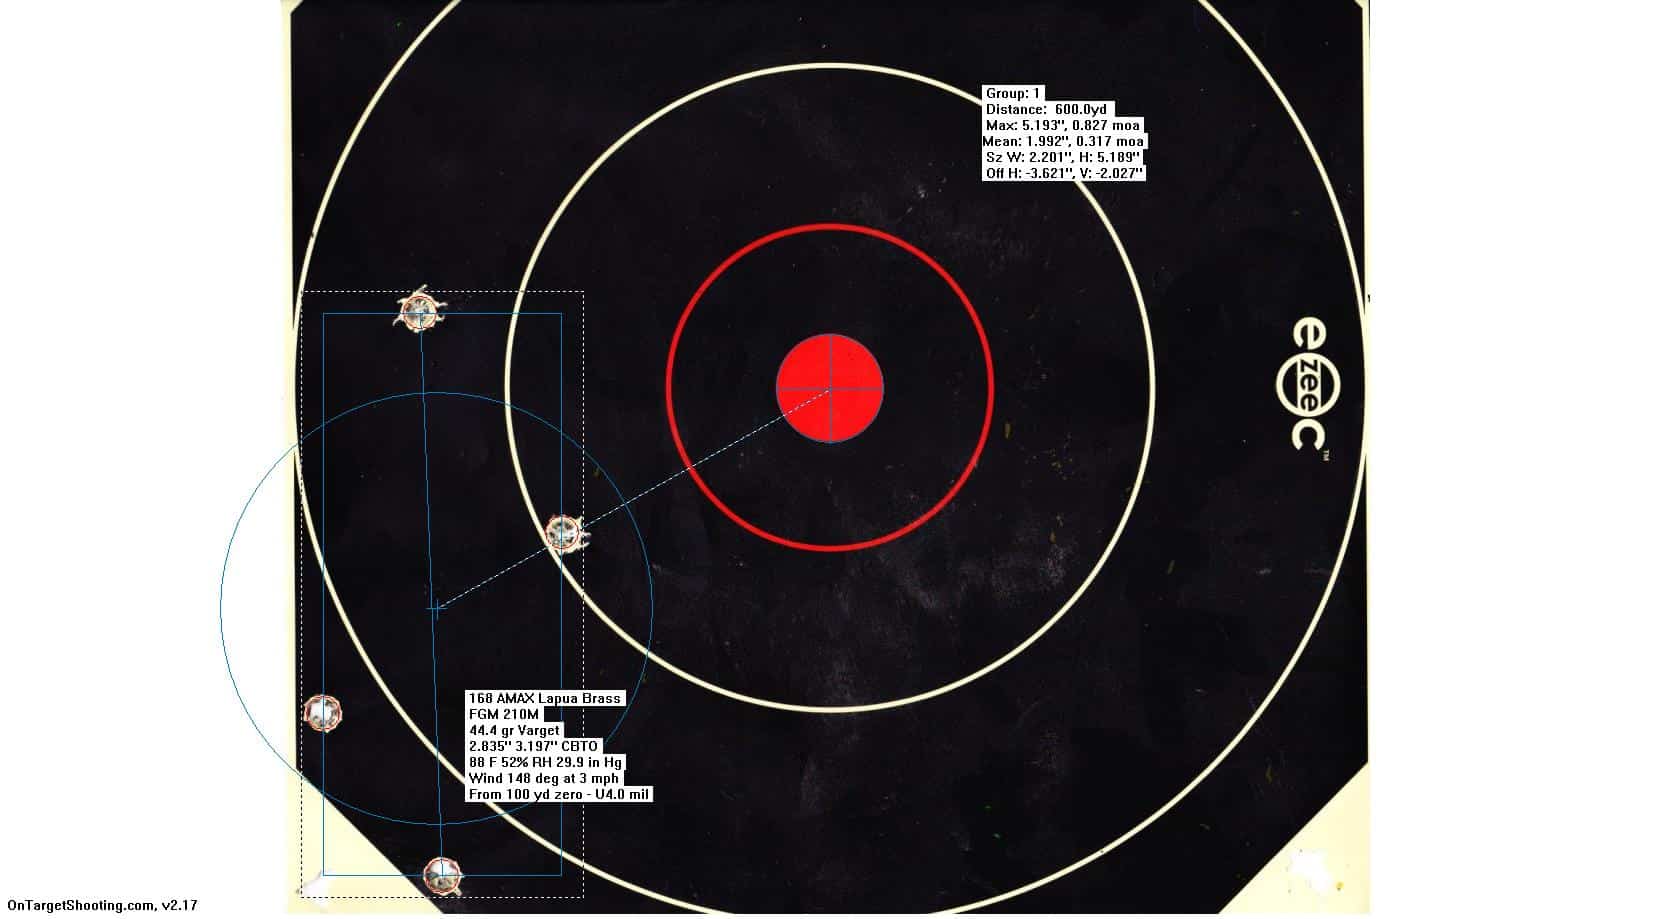
I’ve done some testing with the higher charge weight at 44.8 up to 45.6. It looks promising and I will continue to update this post.

